GeneXus "DebuGX Console" option.
As shown in the picture, the Console is divided in several sections: - Main Menu: It unfolds the available options. - Toolbar: The toolbar is below the Main Menu and it is has the following buttons (from left to right): Open, Save, Delete all the captured steps, Refresh the workspace, Step back, Step forward, Pause, Execute until the following breakpoint, Searcher, Delete all the breakpoints, Enable or disable all the breakpoints. - Objects browser: It shows all the objects specified by the DebuGX Specifier. - Properties: It shows the attribute / variable properties selected in the Objects browser. - Source code browser: It shows the selected object GeneXus code. - Watch list: It shows the selected attributes / variable values in execution. - Alerts: It shows the defined alerts. - Steps: It Shows the number of executed code lines with the possibility of moving backwards or forward.
Breakpoints and Alerts
--------------------------------------------------------------------------------------------
Breakpoint
--------------------------------------------------------------------------------------------
A breakpoint is a stop point in the execution. To insert a breakpoint, either double click on code line in "Source code browser", or right click on the line, and select the "Insert Breakpoint" option.
In case the line has already a breakpoint, the effect is to delete that line´s Breakpoint. All breakpoints may be disable / enable or clear through the button in the "Toolbar" or with the "Debug" menu option.
--------------------------------------------------------------------------------------------
--------------------------------------------------------------------------------------------
Are another kind of stops in the execution. These are conditional stops, that is, breakpoints depending on a condition fulfillment for the execution stop. In the "Alerts" section it needs to be typed a logic condition. When that condition is correct, it would be indicated by an icon on the left.
If the execution stops because of an alert, the same icon will indicate that the running alert.
To disable an alert comment the line with "//"
Note: The attribute or variable names in an alert must be placed before with the object´s name. The object´s name must be written with the letter assigned by GeneXus (i.e: R: Report, W: Work Panel, etc.).
--------------------------------------------------------------------------------------------
When the object to debug obtains the execution, the code line to be executed may be seen in the "Object Browser". Besides lines appear on the left lower margin indicating that the application is in execution.
From that moment, DebuGX controls the execution. In case the "Automatic Pause when start" option is selected in the "Options" menu, the execution will pause in the first code line. Otherwise, the execution will continue until the first Breakpoint.
The existing execution controls are the following:
- Step Forward: This option / button allows to move forward one line in the execution. - Step Back: This option / button allows to move backwards one line in the execution. - Run until the next Breakpoint: This option / button allows to move the execution forward until the next Breakpoint. - Pause Execution: This option / button allows to pause the execution in the line ongoing. - The "Steps" Bar allows to move, back and forth, through the executed code lines .
Place the mouse over any attribute or variable, and all the attributes and variables values in that code line will appear.
To monitor any attribute and / or variable include them on the "Watch List". There are two ways:
1. On GeneXus code, right click on the attribute or variable line. Then, choose "Add To Watch List" option and select the attribute/ variable from the list.
2. Look for the attribute / variable in the "Objects Browser" and double click on its name. If the attribute / variable belongs to a Structured Data Type (SDT) or a Business Component (BC), it will apperar on a new window:
Every time you up date a value or add an item to the collection, this window will refresh, that is, the tree expands and shows the SDT or BC content. To activate or desactivate that function, click on the option "Auto Expand SDT tree" from the "Option" menu.
Selecting an attribute / variable in the "Objects Browser", the "Properties" window will show the defined properties for that attribute / variable.
Char, numeric and date variable values can be change in execution from the DebuGX console. Right click on GeneXus source in the variable line and go to "Change Values" option then select the variable from the list.
Once you select the variable, the following window will appear:
You could see the modified value once it has been determined.
Note: Remember the indicator () shows the GeneXus source line to be executed so for the code to execute, the indicator must move to the following line first.
--------------------------------------------------------------------------------------------
The main characteristic of the events objet's is the possibility to go directly to its definition or to some subroutine. For that, right click on mouse over the "Source code Browser" and go to "Goto Event/Sub" option.
The main characteristic of the events objet's is the possibility to go directly to its definition or to some subroutine. For that, right click on mouse over the "Source code Browser" and go to "Goto Event/Sub" option.
When a Work Panel / Web Panel with Base table doesn´t have defined the "Load" event, DebuGX defines one called "Implicit Load Event". This allows to visualize the attributes values obtained from the Table. (If there is a subfile, this event will be executed for every loaded line) The "Options Automatic Pause when start" menu option (Shown in DebuGX in Report / Procedure) in Work Panel / Web Panel will only work if the "Start" event is defined, otherwise, enter a breakpoint in the desired place.
--------------------------------------------------------------------------------------------
In the transactions, the execution rules may be seen.
- All rules with explicit condition have two execution moments:
1. Before the condition evaluation. On the DebuGX console this moment is showed with the execution indicator () in the corresponding rule line and with an indicator in the condition that will be evaluated.
2. Before the rule triggers (this moment will only exist if the condition evaluation was genuine). In this moment, the DebuGX´s Console preserves the execution indicator in the corresponding rule line and shows an indicator in the rule that will be triggered.
- In the rules without explicit condition, the execution indicator () will be seen in the corresponding rule line and an indicator is shown in the rule that will be shooted. In this way, you are able to see every rule moment and obtain the attributes and / or variables values before each one. If the "Always Pause on Rules" option is selected in the "Options" menu the execution will pause in each rule before being evaluated and / or before being shooted, depending on the case. If not, the execution will continue until the first breakpoint.
In "Rules" section there may be differences with the ones defined in GeneXus . This happens because of the following:

Examples:
1. The rule "Serial(att1 , att2 , step);" will be turned into the following rules: att2 = old(att2 ) step IF insert AND level( att1 ); att1 = att2 IF insert;
2. The rule "Default(att &var , expression);" will be transformed into: att &var = expression IF insert AND null( att &var ) AND &GxBScreen = 0;
Formula attributes Some formulas are solved through rules.
Example:
1. The InvoiceTotal? attribute (an Invoice total) defined as a formula: SUM (InvoiceLinetotal) (vertical Sum) is solved by the following rules: InvoiceTotal? = old(InvoiceTotal) InvoiceLineTotal? IF insert; InvoiceTotal? = old(InvoiceTotal) InvoiceLineTotal? - old(InvoiceLineTotal) IF update; InvoiceTotal? = old(InvoiceTotal) - old(InvoiceLineTotal) IF delete;
Attributes with value range The attribute validity ranks are solved by rules.
Example:
1. The InvoiceLineQty? attribute (item amount) defined with the following rank: 1:20; is solved by the following rule: Error( 'Field Quantity is out of range' ) IF NOT ( ( InvoiceLineQty? >= 1 AND InvoiceLineQty? <= 20]] The GeneXus Specifier makes these transformations and they are seen in the detailed navigation.
--------------------------------------------------------------------------------------------
Remote DebuGX
--------------------------------------------------------------------------------------------
Remote DebuGX
--------------------------------------------------------------------------------------------
Once the GeneXus specification objects is finished, they have to be specified with DebuGX.
For that the "Specify with DebuGX" option is located in the "Tools" menu.
For that the "Specify with DebuGX" option is located in the "Tools" menu.
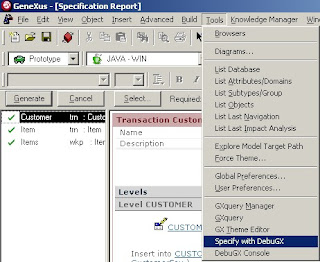
Once that option is selected the DebuGX Specifier will unfold, in which the objects specified by GeneXus and pending of generation, are shown.
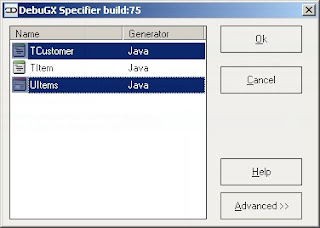
Select the object / s that will be debugged (for a multiple selection the press Ctrl key and select objects with the mouse). Press "Advanced" and the following option unfolds:

Indicate the IP address of the PC where the object is being executed ("remote PC"). In a Stand Alone execution, enter "localhost" or "127.0.0.1". A window indicating the specification process of DebuGX Specifier will be shown by pressing the "OK" key.
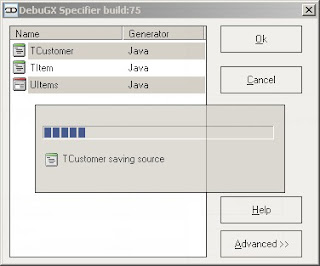
Send new version
Once you get the object wih the DebuGX information, send to the "remote PC" both the object and a file located in the Debugx 2.0 Installation folder (the default directory is "c:Program filesDebuGX 2.0") called "RemoteDebuGX? .exe".
Execute Remote DebuGX
Execute Remote DebuGX
Execute in "remote PC" the sent file ("RemoteDebuGX? .exe"). Then this window appear:
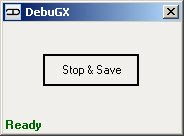
Execution
Execute the application from your usual start point and wait for the object to debug execution. At the beginning of the object execution, you will see on the inferior left margin in remote DebuGX a legend that indicates the execution is taking place.
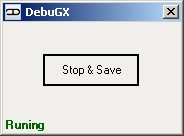
Once the execution has finished, click on "Stop & Save". A window indicating the name and location of the file to be saved will unfold.

DebuGX Console
To execute the console, go to the DebuGX Console option in the "Tools" menu. Then, go to the "Open" option in the "File" menu and click on the "Remote Debug Execution".
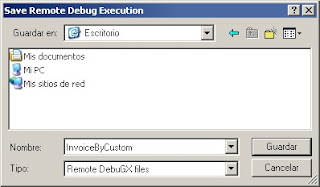
Execution procedure in the console is like an online execution.
SCARICATELO QUI -


Nessun commento:
Posta un commento